Spotlight on the China Market for Analytical Instruments

In both our 2017 Global Assessment Report: The Analytical and Life Science Instrument Market and our survey of life science lab budgets we reported that Asian markets were growing faster than scientific markets in the US and Europe. Chinese in particular is of great interest to our clients and we will soon be publishing a new report specifically on the size and growth of this nearly $6 billion market.
In the third quarter of last year, the National Bureau of Statistics of China (NBS) released its annual “China Statistical Yearbook,” a compilation of figures representing growth in various socio-economic sectors in the country from the previous year. The NBS’s 2016 Yearbook analyzes data from federal ministries such as the Ministry of Science and Technology, Ministry of Education, the China Association of Science and Technology, the State Administration of Science, Technology and Industry, as well as the NBS itself, with a focus on scientific and technological (S&T) R&D activities in China in 2015 in various sectors, enterprises, and institutions.
Data indicated an extremely significant rise in supervised enterprise sampling checks to determine and ensure quality of products. The food sector had the most dramatic increase in this category, most likely due to China’s updated Food Safety Law in April 2015. Statistics also illustrated a decrease in R&D personnel from 2014 and a drop in postgraduate science graduates.
In 2015, the ratio of R&D expenditure to GDP was 2.07%, a increase of 5 basis points and 8 basis points from 2014 and 2013, respectively. This ratio has been on a steady rise since 2011, when it was 1.78% of GDP. According to Caixin Online, China’s total R&D expenditure for 2015 was over CNY 1.4 trillion ($202.8 billion), 2.1% of the country’s GDP.
Institutions
As the NBS figures illustrated, the number of established S&T R&D institutions has also increased over the years, with 5,572 official institutes in 2015, up 17.0% from the 4,763 institutions in 2014, and up 3.9% from the 4,583 institutions in 2013, indicating the stable growth of S&T research and innovation in China. Data indicated a total of 29,631 S&T enterprises in 2015, up 6.1% from 2014 and 10.2% from 2013.
There were 11,732 Chinese S&T research institutions in 2015. Of these, 2,560 were higher education institutes (HEI), a 1.2% and 2.8% increase from 2014 and 2013, respectively. Natural Sciences and Technology institutes comprised 1,713 of these HEI.
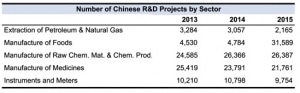
The increase in the number of research institutes correlates to the rise in R&D projects taken on in 2015, as well. A total of 841,520 R&D projects were undertaken in 2015, up 9.8% from 2014 and 18.4% from 2013. The R&D projects amounted to CNY 765.6 billion ($114.7 billion) in 2015, an increase of 7.8% and 14.2% from 2014 and 2013, respectively.
There were 309,895 S&T R&D projects in 2015. The number of R&D projects was the greatest in Zhejiang, which represented 51,940, or 17%, of all S&T R&D projects, closely followed by Jiangsu with 51,720 or 17%, Guangdong with 37,375 or 12%, Shandong with 30,778 or 10%, and Anhui with 14,100 or 5%.
Graduates
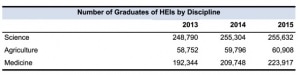
In 2015, the numbers of students completing a second degree in science marginally dropped compared to 2014. By field, in 2015, 48,856 postgraduate students completed science programs, compared to 49,002 in 2014 and 29,992 in 2013. There were 62,602 postgraduates from the medicine field in 2015, up 2.3% from 2014 and 6.9% from 2013, while 20,288 postgraduates completed agriculture programs, an increase of 4.3% compared to 2014 and 16.2% from 2013.
Scientific Papers and Medicine
China is a top producer of scientific papers, releasing 235,139 in total in 2015. This is an increase of 22.0% from 2014 and 48.3% from 2013. Of the total 2015 scientific papers,41,378 were in chemistry; 26,520 in physics; 24,885 in biology; 5,949 in pharmacy; 4,486 in energy; 2,732 in agriculture; and 2,247 in food. Many papers also focused on medicine, with 11,589 papers in basic medicine, 2,441 in protective medicine, 119 in special medicine, 930 in traditional Chinese medicine and 31,104 in clinical medicine; These numbers referred to papers published in the Science Citation Index.
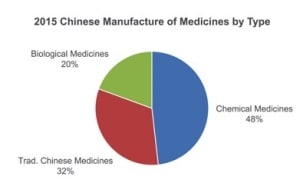
The increase in medicinal R&D is reflected in the rise of manufactured medicines in 2015. China’s medicine focus concentrates on biological, chemical and finished traditional Chinese medicine. There were 7,392 medicines manufactured in 2015, a 4.0% jump from 2014, with 2,416 chemical medicines manufactured, 1,622 traditional Chinese medicines and 975 biological medicines.
Sampling Checks
The Yearbook also provided information on state security sampling checks to determine the quality of products. A total of 24,415 enterprises were supervised for sampling checks, with 3,891 checks in the food sector and 1,699 in the “agricultural means of production” sector. These numbers are significantly higher from previous years. In 2013, 139 enterprises in total were supervised for sampling checks, with only 4 sampling checks conducted for food, and 16 performed in the agricultural sector. In 2014, out of a total of 159 supervised sampling checks, food had 5 sampling checks and agriculture had 11. This weighty increase in sampling checks is likely due to 2015’s amended Food Safety Law, in which Article 3 states that food safety is to undergo a “stringent supervision and administration system” to ensure that food manufacturers are held accountable for their products through “social supervision.”
Region wise, Sichaun had the greatest number of supervised enterprise sampling check for product quality at 8,886, a 1.5% increase from 2014, but a 2.4% decrease from 2013. Gansu followed Sichaun with 6,777 supervised enterprise sampling checks in 2015, a 98.8% increase from 2014 and 291.5% increase from 2013. In Shandong, 6,617 supervised enterprise sampling checks were performed, up 62.9% from 2014 and 180.5% from 2013.
This article originally appeared in the February 1st edition of our executive newsletter Instrument Business Outlook. If you would like to receive a free trial subscription, please click here.


