Market Research Toolbox: Determine What’s Truly Important for Creating Satisfied Customers
Addressing Issues Related to Customer Satisfaction
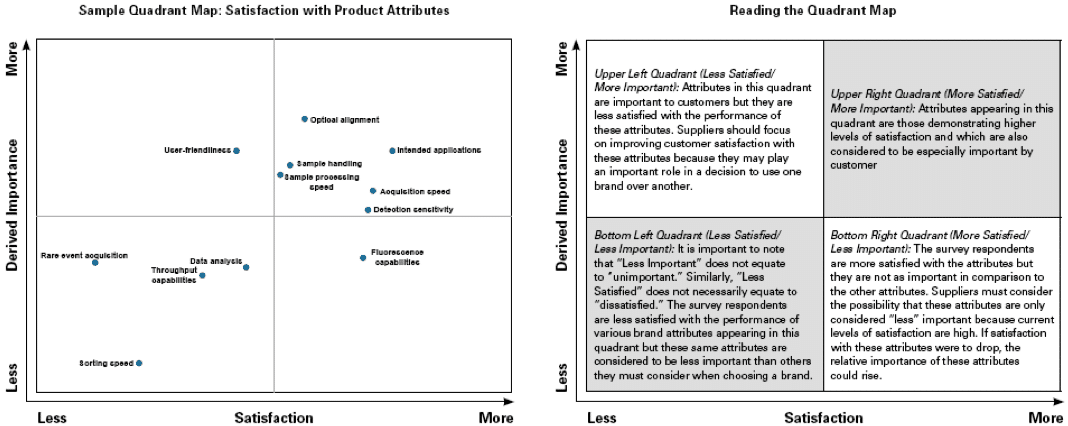
Determining what drives customers’ satisfaction level for certain products and services can be difficult to measure given changing customer behavior in the market. With knowledge of which attributes are most highly associated with satisfaction for a product, suppliers can identify where their performance falls below expectations. But simply asking scientists what they consider important in their purchasing decisions often generates misleading customer satisfaction data, such as responses that rank most product attributes to be equally important. In Customer Satisfaction Analysis, BioInformatics’ Derived Importance Modeling extracts the truth by analyzing all product attributes and satisfaction simultaneously, then by plotting the combined interaction of a Quadrant map. The results allow you to easily visualize underperforming and overachieving attributes.
Case Study: Customer Satisfaction with Product Features of Antibodies
In the market for pre-made antibodies, BioInformatics evaluated and compared nine product features in order to answer two questions. How much does a particular product feature influence perceived quality? And how much does the perception of quality influence customer satisfaction? The analysis revealed areas where product improvement would increase satisfaction, as well as features where product differentiation could be obtained. Improvements to features rates as “highly important but not highly satisfied” will result in increased general satisfaction levels. Likewise, avoiding investments to improve those features rated as “not important, but highly satisfied” will increase the impact of marketing and product development efforts on customer satisfaction.
Delivering Product Feature Importance and Influence on Satisfaction
We measure each respondent’s level of satisfaction with the specific product features that you select. We also assess the respondent’s overall level of satisfaction with the product or service. The analysis requires only a few pieces of data to be collected:
- Level of satisfaction with specific features of {product X} from [supplier X]
- Overall satisfaction with {product X} from [supplier X]
Using a statistical technique called bivariate correlation, each product attribute is plotted on a quadrant map. Quadrants are a useful tool for visualizing the relative importance of various product attributes and the relationship of the attributes to satisfaction. The example displays the results of a commonly used product in the antibodies market.
Adding a customer segmentation to this analysis provides even more detail and can be performed by almost any variable, whether demographic, firmographic, primary supplier, etc. For industrial life scientists, we found that antibody form is more important than purity, yet the reverse is true for academic life scientists.
Delivering Results
BioInformatics’ Derived Importance Model was able to pinpoint product features requiring immediate attention by the supplier to increase customers’ overall satisfaction. These identified areas in which efforts made by the supplier were less important to life scientists so that resources can be aligned for greater efficiency.
Understanding customer satisfaction and acting on its key drivers can provide noticeable return and build long-lasting relationships between the customer and the supplier.
