Market Research Toolbox: A Way to Amplify Your Chance of Success Before Entering a New Market

Entering a New Market As A Vehicle for Growth
In the highly competitive life science industry, companies assess options before entering a new market, often by using opportunity analysis tools. However, employing such tools without gathering unbiased market data and insights only illustrates internal stakeholders’ guesses, which may be far from reality. (“Entering New Markets: Talking to yourself is not a strategy.” The Linus Report. September/October 2005.)
Before deciding on which market to enter, it is important to determine which market fits optimally with your company’s internal strengths and which market is most attractive for your company based on external industry factors. To give you the greatest chance of success in a new market, we leverage our market research techniques and life science experience to deliver you a data-driven model for fact-based decision-making.
Case Study: Which new product line will best complement our current business portfolio?
Our client was considering introducing one or more new product lines that would cater to those scientists willing to purchase products from a commercial supplier rather than developing in-house products. With established suppliers in each of the product categories under consideration, our client wanted to verify whether each of these categories was a good fit for their brand. BioInformatics’ Market Attractiveness model was able to address all of the client’s questions.
Market Attractiveness Model: Building a Market Map
The first step in evaluating a new product line using our market attractiveness model is to create a list of the most relevant and critical factors, both internal and external (about 3-6 factors each), to be evaluated by survey respondents who are scientific researchers in the field. A few examples of these factors are:
| Internal | External |
| Access to financial resources | Competitive intensity / rivalry |
| Customer loyalty | Current usage |
| Market share | Market growth rate |
| Production capacity | Market size / maturity |
| Relative brand awareness | Price sensitivity |
Each of the factors selected are weighted by importance and relevance to your company. Once the framework for the model is determined, we then develop a questionnaire that enables us to gather information on the factors selected. The questionnaire also enables us to calculate market size, share and growth of the product lines in question, along with questions related to brand and satisfaction to evaluate how your company is perceived in the market.
Using input from the customers who comprise the market in tandem with secondary research, each of the critical factors is given a “score” out of 5 possible points. Using the factor’s score and assigned weight, an overall market attractiveness and competitive strength value for each product line is produced. The outcome is then charted:
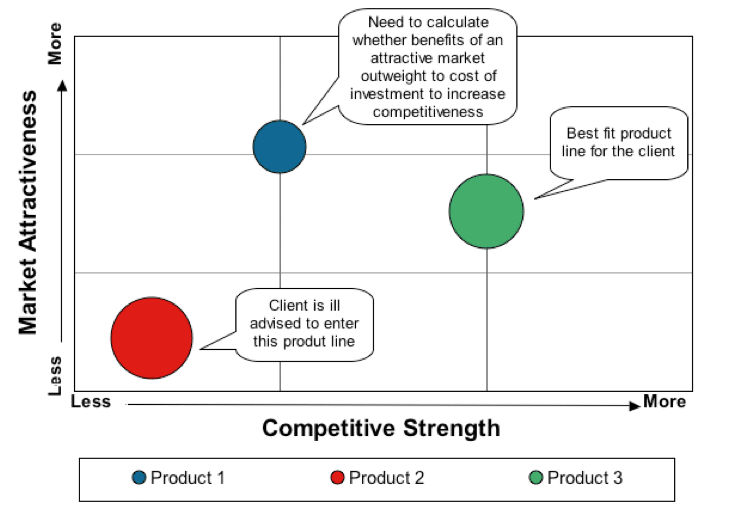
Each circle on the market map represents one of the three product lines under consideration. The size of the circle is proportional to the product’s current market size. Each circle’s unique position along the x-axis and y-axis presents our client with decision-making data for each option. (*2 Adapted from the GE/McKinsey Matrix.)
Delivering Results
By assessing both market attractiveness via external factors and competitive strength via internal factors, BioInformatics used a data-driven Market Attractivess Model to identify which product line was most attractive based on both internal and external factors. As a result, our client was able to evaluate their own internal strengths and weaknesses and discover which product line was the best fit with their brand and product portfolio.
To get more information on BioInformatics’ Market Estimation or to discuss further details of your potential market study, please contact info@gene2drug.com.

